echarts 如何自定义图形
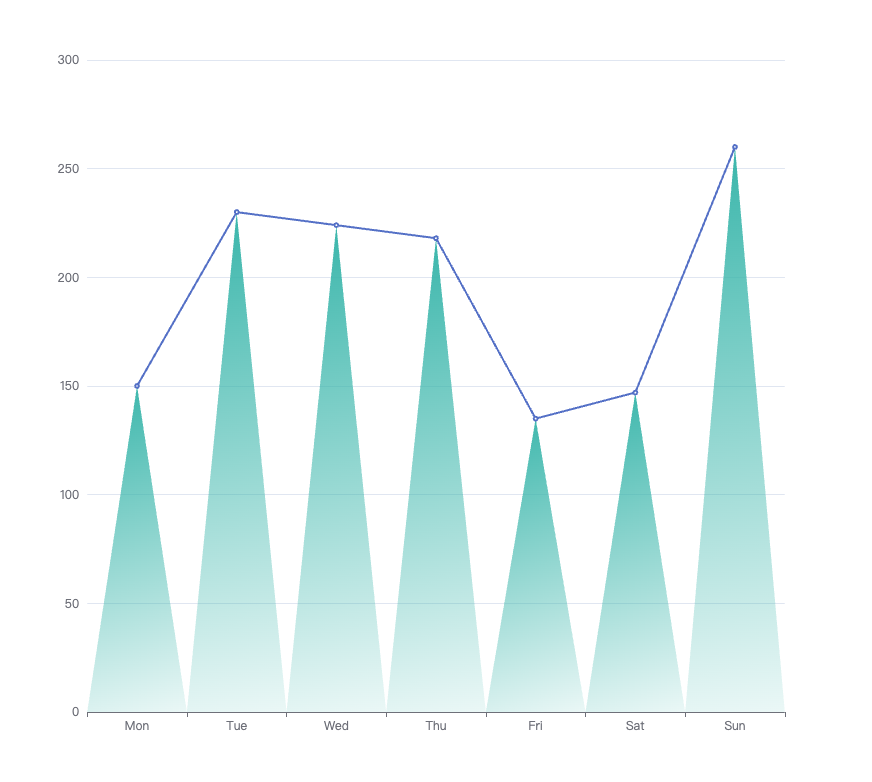
实现效果

代码
javascript
option = {
    xAxis: {
        type: "category",
        data: ["Mon", "Tue", "Wed", "Thu", "Fri", "Sat", "Sun"],
    },
    tooltip: {},
    yAxis: {
        type: "value",
    },
    series: [
        {
            data: [150, 230, 224, 218, 135, 147, 260],
            type: "line",
        },
        {
            type: "custom",
            renderItem: function (params, api) {
                // 获取给定点位映射到canvas上的坐标点位。
                let point = api.coord([api.value(0), api.value(1)]);
                // 获取横向坐标轴的宽度
                let size = api.size(0, 1)[0] / 2;
                let height = params.coordSys.y + params.coordSys.height;
                // 创建渐变色对象,用于图形渐变
                var color = new echarts.graphic.LinearGradient(0, 0, 1, 1, [
                    { offset: 0, color: "rgba(56, 181, 170,1)" },
                    { offset: 1, color: "rgba(56, 181, 170,.1)" },
                ]);
                return {
                    type: "polygon",
                    shape: {
                        // 设置点位
                        points: [
                            [point[0], point[1]],
                            [point[0] - size, height],
                            [point[0] + size, height],
                        ],
                    },
                    style: {
                        fill: color,
                    },
                };
            },
            data: [150, 230, 224, 218, 135, 147, 260],
        },
    ],
};
- 主要是通过
series里面type为custom来实现,其中有个renderItem方法,可以返回一个自定义图形对象。 api.value(...),意思是取出 dataItem 中的数值。例如api.value(0)表示取出当前 dataItem 中第一个维度的数值。api.coord(...),意思是进行坐标转换计算。例如var point = api.coord([api.value(0), api.value(1)])表示dataItem中的数值转换成坐标系上的点。
坑点
- 看官方文档里面
renderItem返回的style.fill支持string格式,但是其实是可以支持LinearGradient对象的。
 lrurif